
In this post I investigate the machine learning algorithm known as logistic regression. Despite the name, this is actually a classification method. In other words, we are using our features to predict a categorical response variable , which represents qualitative data: yes/no, good/bad, small/medium/large, etc. For simplicity, we are going to assume that may take on just two values, and . We will discuss the more general question of what happens when there are or more categories involved at the end of the post.
Given a new data point , we want to determine whether to assign it the value or . Instead of trying deal with the function directly, logistic regression attempts to approximate , the conditional probability that is given that take on the values . Then we may assign this data point the value of if we estimate a probability higher than , and the value otherwise. A benefit in using this probability function, rather than directly, is that it takes its values on an interval, and thus we may apply calculus methods.
A first thought may be to approximate by a line, but there is an obvious issue with this: any non-horizontal line (and note that a horizontal line would not be a useful approximation) takes values from negative infinity to infinity, while we know that should only take values from 0 to 1.
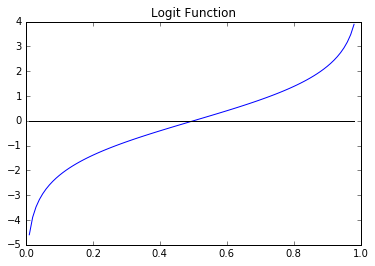
To fix this, note that takes the interval to the positive real numbers , and the natural logarithm takes the positive reals to the entire real line . Thus applying these functions in succession takes the open interval to . This composition, , is called the function, denoted . The graph of the logit function looks like this:

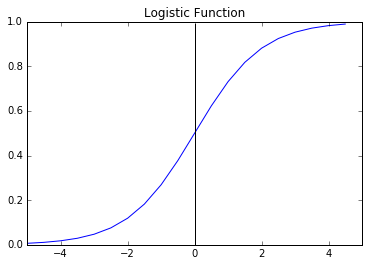
Also important to us is the inverse of the logit function, given by . This is called the , and its graph is called the S-curve:

Our complaint about not being a good candidate for linear regression is no longer true after applying the logit function. The key idea behind logistic regression is that we can approximate by a linear function: \[ \text{logit}\,(p) \sim \beta_0 + \beta_1 \cdot X \] Applying the logistic function to both sides, we get the following approximation: \[ p \sim \displaystyle{\frac{1}{1 + e^{\, -(\beta_0 + \beta_1 \cdot X)}}} \]
The coefficients and can be found using maximum liklihood estimates (MLE), as we explain in that post, and this gives us our desired prediction.
Now suppose that the response variable takes possible values. Then for each we can approximate by: \[ p^{(c)} \sim \displaystyle{\frac{1}{1 + e^{\, -(\beta^{(c)}_0 + \beta^{(c)}_1 \cdot X)}}} \]
We then assign the value corresponding to the largest probability. Again, the coefficients can be predicted using MLE.